

-
- Height:
- 6-7
-
- Weight:
- 210
-
- Year:
- So.
-
- Hometown:
- Chicago, Ill.
-
- High School:
- Whitney M. Young HS
-
- Position:
- F
-
- Major:
- Sport Management
-
- Phone:
- @TysonLeitao
-
- gp
- 24
-
- pts/g
- 10.9
-
- fg %
- 45.7
-
- 3pt %
- 29.2
-
- ft %
- 64.6
-
- reb/g
- 9.1
-
- a/g
- 1.5
Bio
As a Freshman: Played in 25 games, and started in all 25…His 26.3 minutes per game and 657 total minutes ranked him fourth on the team…Ranked third on the team with 5 rebounds per game and 125 total…His 0.7 blocks per game and 17 total ranked him second on the team…Season-high in: points with 13 on 5-of-8 shots in a road win at Saint Leo (1/5), rebounds with 11 against No. 7 Embry-Riddle (12/8), assists with 3 in a victory against Rollins (1/12), and blocks with 3 in a road win at Palm Beach Atlantic (2/26)...Recorded a rebound in 24-of-25 games played…5 or more rebounds in thirteen games…Second on the team with 47 offensive rebounds.
High School: Attended Whitney M Young Magnet High School where he played for head coach Tyrone Slaughter…Also played club basketball on the Illinois Stars where he played for head coach Troy Johnson.
Personal: Sport Management major...son of Joyce and David…Two siblings, David and Reese…Volunteered with Breakthrough Community Services…Born November 8, 2002.
Recent games
Season Statistics
| Overall | Conference | |
|---|---|---|
| Games | 24 | 18 |
| Games started | 24 | 18 |
| Minutes | 732 | 554 |
| Minutes per game | 30.5 | 30.8 |
| FG | 95-208 | 74-157 |
| FG Pct | 45.7 | 47.1 |
| 3PT | 7-24 | 6-15 |
| 3PT Pct | 29.2 | 40.0 |
| FT | 64-99 | 49-73 |
| FT Pct | 64.6 | 67.1 |
| Off rebounds | 52 | 37 |
| Def rebounds | 167 | 133 |
| Total rebounds | 219 | 170 |
| Rebounds per game | 9.1 | 9.4 |
| Personal fouls | 63 | 49 |
| Disqualifications | - | - |
| Assists | 37 | 28 |
| Turnovers | 57 | 44 |
| Assist to turnover ratio | 0.6 | 0.6 |
| Steals | 14 | 9 |
| Blocks | 15 | 12 |
| Points | 261 | 203 |
| Points per game | 10.9 | 11.3 |
| Points per 40 min | 14.3 | 14.7 |
Game Log - Shooting
| Date | Opponent | Score | gs | min | fg | pct | 3pt | pct | ft | pct | pts |
|---|---|---|---|---|---|---|---|---|---|---|---|
| Nov 11 | vs. Montevallo | L, 77-74 | 1 | 35 | 5-10 | 50.0 | 1-4 | 25.0 | 3-6 | 50.0 | 14 |
| Nov 12 | at #24 Alabama-Huntsville | L, 80-71 | 1 | 31 | 3-7 | 42.9 | 0-0 | - | 2-4 | 50.0 | 8 |
| Nov 20 | Barry | W, 72-69 | 1 | 20 | 0-1 | 0.0 | 0-1 | 0.0 | 0-0 | - | 0 |
| Nov 25 | vs. Wayne State (Neb.) | L, 72-63 | 1 | 33 | 2-12 | 16.7 | 0-2 | 0.0 | 3-5 | 60.0 | 7 |
| Nov 26 | vs. Davenport | L, 64-58 | 1 | 18 | 2-4 | 50.0 | 0-0 | - | 1-3 | 33.3 | 5 |
| Nov 30 | at Florida Tech | L, 65-59 | 1 | 22 | 0-2 | 0.0 | 0-1 | 0.0 | 0-0 | - | 0 |
| Dec 3 | #13 Embry-Riddle | W, 78-77 | 1 | 38 | 4-13 | 30.8 | 1-2 | 50.0 | 4-4 | 100.0 | 13 |
| Dec 17 | North Georgia | L, 69-53 | 1 | 36 | 4-7 | 57.1 | 0-2 | 0.0 | 1-2 | 50.0 | 9 |
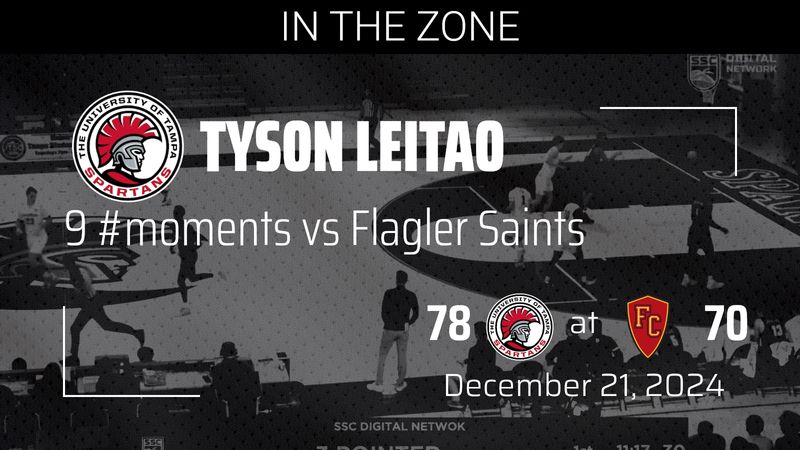
| Dec 18 | Flagler | W, 84-81 | 1 | 25 | 5-11 | 45.5 | 0-1 | 0.0 | 5-6 | 83.3 | 15 |
| Dec 29 | Palm Beach Atlantic | W, 72-65 | 1 | 30 | 0-6 | 0.0 | 0-0 | - | 2-4 | 50.0 | 2 |
| Jan 1 | at Lynn | W, 77-66 | 1 | 33 | 2-3 | 66.7 | 0-0 | - | 2-2 | 100.0 | 6 |
| Jan 4 | at Saint Leo | L, 77-71 | 1 | 33 | 6-10 | 60.0 | 1-1 | 100.0 | 0-0 | - | 13 |
| Jan 7 | Rollins | L, 71-66 | 1 | 28 | 3-7 | 42.9 | 0-1 | 0.0 | 0-0 | - | 6 |
| Jan 11 | at #2 Nova Southeastern | L, 113-69 | 1 | 29 | 4-9 | 44.4 | 0-0 | - | 6-9 | 66.7 | 14 |
| Jan 14 | Eckerd | W, 80-73 | 1 | 32 | 5-11 | 45.5 | 0-1 | 0.0 | 4-8 | 50.0 | 14 |
| Jan 18 | at Florida Southern | L, 96-67 | 1 | 32 | 8-15 | 53.3 | 0-2 | 0.0 | 5-8 | 62.5 | 21 |
| Jan 21 | at Embry-Riddle (Fla.) | L, 87-72 | 1 | 36 | 6-11 | 54.5 | 1-1 | 100.0 | 5-6 | 83.3 | 18 |
| Jan 28 | Lynn | W, 83-60 | 1 | 30 | 3-5 | 60.0 | 0-0 | - | 5-10 | 50.0 | 11 |
| Feb 1 | at Rollins | L, 75-60 | 1 | 36 | 3-11 | 27.3 | 0-0 | - | 3-4 | 75.0 | 9 |
| Feb 4 | at Palm Beach Atlantic | L, 79-77 | 1 | 32 | 7-12 | 58.3 | 0-0 | - | 0-1 | 0.0 | 14 |
| Feb 8 | Saint Leo | L, 77-72 | 1 | 35 | 7-10 | 70.0 | 1-1 | 100.0 | 6-8 | 75.0 | 21 |
| Feb 11 | Florida Southern | L, 91-84 | 1 | 34 | 10-17 | 58.8 | 2-4 | 50.0 | 0-1 | 0.0 | 22 |
| Feb 15 | at Eckerd | W, 80-76 | 1 | 24 | 3-6 | 50.0 | 0-0 | - | 2-2 | 100.0 | 8 |
| Feb 18 | #1 Nova Southeastern | L, 115-77 | - | - | - | - | - | - | - | - | - |
| Feb 22 | at Barry | L, 67-54 | 1 | 30 | 3-8 | 37.5 | 0-0 | - | 5-6 | 83.3 | 11 |
| Feb 25 | Florida Tech | L, 94-76 | - | - | - | - | - | - | - | - | - |
Game Log - Ball control
| Date | Opponent | Score | gs | min | off | def | reb | ast | to | stl | blk |
|---|---|---|---|---|---|---|---|---|---|---|---|
| Nov 11 | vs. Montevallo | L, 77-74 | 1 | 35 | 1 | 6 | 7 | 1 | 1 | 1 | 1 |
| Nov 12 | at #24 Alabama-Huntsville | L, 80-71 | 1 | 31 | 4 | 3 | 7 | 4 | 0 | 1 | 1 |
| Nov 20 | Barry | W, 72-69 | 1 | 20 | 1 | 7 | 8 | 0 | 2 | 0 | 0 |
| Nov 25 | vs. Wayne State (Neb.) | L, 72-63 | 1 | 33 | 3 | 7 | 10 | 2 | 1 | 1 | 0 |
| Nov 26 | vs. Davenport | L, 64-58 | 1 | 18 | 2 | 6 | 8 | 0 | 3 | 0 | 0 |
| Nov 30 | at Florida Tech | L, 65-59 | 1 | 22 | 2 | 6 | 8 | 1 | 2 | 0 | 0 |
| Dec 3 | #13 Embry-Riddle | W, 78-77 | 1 | 38 | 3 | 2 | 5 | 0 | 0 | 0 | 0 |
| Dec 17 | North Georgia | L, 69-53 | 1 | 36 | 1 | 4 | 5 | 1 | 4 | 1 | 1 |
| Dec 18 | Flagler | W, 84-81 | 1 | 25 | 4 | 8 | 12 | 1 | 4 | 1 | 0 |
| Dec 29 | Palm Beach Atlantic | W, 72-65 | 1 | 30 | 3 | 8 | 11 | 2 | 1 | 1 | 0 |
| Jan 1 | at Lynn | W, 77-66 | 1 | 33 | 2 | 8 | 10 | 1 | 4 | 2 | 2 |
| Jan 4 | at Saint Leo | L, 77-71 | 1 | 33 | 6 | 8 | 14 | 0 | 1 | 1 | 0 |
| Jan 7 | Rollins | L, 71-66 | 1 | 28 | 2 | 5 | 7 | 1 | 1 | 0 | 1 |
| Jan 11 | at #2 Nova Southeastern | L, 113-69 | 1 | 29 | 3 | 7 | 10 | 1 | 3 | 0 | 0 |
| Jan 14 | Eckerd | W, 80-73 | 1 | 32 | 1 | 5 | 6 | 2 | 3 | 0 | 1 |
| Jan 18 | at Florida Southern | L, 96-67 | 1 | 32 | 2 | 8 | 10 | 1 | 2 | 0 | 1 |
| Jan 21 | at Embry-Riddle (Fla.) | L, 87-72 | 1 | 36 | 2 | 12 | 14 | 5 | 0 | 2 | 2 |
| Jan 28 | Lynn | W, 83-60 | 1 | 30 | 0 | 5 | 5 | 4 | 2 | 0 | 0 |
| Feb 1 | at Rollins | L, 75-60 | 1 | 36 | 1 | 12 | 13 | 2 | 2 | 1 | 0 |
| Feb 4 | at Palm Beach Atlantic | L, 79-77 | 1 | 32 | 1 | 4 | 5 | 1 | 3 | 0 | 2 |
| Feb 8 | Saint Leo | L, 77-72 | 1 | 35 | 3 | 10 | 13 | 1 | 3 | 1 | 0 |
| Feb 11 | Florida Southern | L, 91-84 | 1 | 34 | 1 | 9 | 10 | 3 | 6 | 0 | 3 |
| Feb 15 | at Eckerd | W, 80-76 | 1 | 24 | 3 | 8 | 11 | 1 | 4 | 0 | 0 |
| Feb 18 | #1 Nova Southeastern | L, 115-77 | - | - | - | - | - | - | - | - | - |
| Feb 22 | at Barry | L, 67-54 | 1 | 30 | 1 | 9 | 10 | 2 | 5 | 1 | 0 |
| Feb 25 | Florida Tech | L, 94-76 | - | - | - | - | - | - | - | - | - |
Game Log - Ball control extended
| Date | Opponent | Score | gs | pf | dq | a/to |
|---|---|---|---|---|---|---|
| Nov 11 | vs. Montevallo | L, 77-74 | 1 | 3 | - | 1.0 |
| Nov 12 | at #24 Alabama-Huntsville | L, 80-71 | 1 | 2 | - | - |
| Nov 20 | Barry | W, 72-69 | 1 | 3 | - | 0.0 |
| Nov 25 | vs. Wayne State (Neb.) | L, 72-63 | 1 | 1 | - | 2.0 |
| Nov 26 | vs. Davenport | L, 64-58 | 1 | 4 | - | 0.0 |
| Nov 30 | at Florida Tech | L, 65-59 | 1 | 3 | - | 0.5 |
| Dec 3 | #13 Embry-Riddle | W, 78-77 | 1 | 3 | - | - |
| Dec 17 | North Georgia | L, 69-53 | 1 | 2 | - | 0.3 |
| Dec 18 | Flagler | W, 84-81 | 1 | 2 | - | 0.3 |
| Dec 29 | Palm Beach Atlantic | W, 72-65 | 1 | 1 | - | 2.0 |
| Jan 1 | at Lynn | W, 77-66 | 1 | 3 | - | 0.3 |
| Jan 4 | at Saint Leo | L, 77-71 | 1 | 4 | - | 0.0 |
| Jan 7 | Rollins | L, 71-66 | 1 | 1 | - | 1.0 |
| Jan 11 | at #2 Nova Southeastern | L, 113-69 | 1 | 3 | - | 0.3 |
| Jan 14 | Eckerd | W, 80-73 | 1 | 4 | - | 0.7 |
| Jan 18 | at Florida Southern | L, 96-67 | 1 | 4 | - | 0.5 |
| Jan 21 | at Embry-Riddle (Fla.) | L, 87-72 | 1 | 2 | - | - |
| Jan 28 | Lynn | W, 83-60 | 1 | 2 | - | 2.0 |
| Feb 1 | at Rollins | L, 75-60 | 1 | 1 | - | 1.0 |
| Feb 4 | at Palm Beach Atlantic | L, 79-77 | 1 | 4 | - | 0.3 |
| Feb 8 | Saint Leo | L, 77-72 | 1 | 4 | - | 0.3 |
| Feb 11 | Florida Southern | L, 91-84 | 1 | 3 | - | 0.5 |
| Feb 15 | at Eckerd | W, 80-76 | 1 | 4 | - | 0.3 |
| Feb 18 | #1 Nova Southeastern | L, 115-77 | - | - | - | - |
| Feb 22 | at Barry | L, 67-54 | 1 | 0 | - | 0.4 |
| Feb 25 | Florida Tech | L, 94-76 | - | - | - | - |
| gp | gs | min | fg | pct | 3pt | pct | ft | pct | pts | |
|---|---|---|---|---|---|---|---|---|---|---|
| 2021-22 | 25 | 25 | 657 | 38-84 | 45.2 | 1-7 | 14.3 | 31-55 | 56.4 | 108 |
| 2022-23 | 24 | 24 | 732 | 95-208 | 45.7 | 7-24 | 29.2 | 64-99 | 64.6 | 261 |
| 2023-24 | 28 | 27 | 843 | 129-289 | 44.6 | 10-27 | 37.0 | 94-140 | 67.1 | 362 |
| 2024-25 | 31 | 31 | 886 | 152-326 | 46.6 | 13-38 | 34.2 | 130-178 | 73.0 | 447 |
| Total | 108 | 107 | 3118 | 414-907 | 45.6 | 31-96 | 32.3 | 319-472 | 67.6 | 1178 |
Career Stats: Shooting totals
| gp | min | min/g | fg/40 | 3pt/40 | pct | ft/40 | pts/40 | |
|---|---|---|---|---|---|---|---|---|
| 2021-22 | 25 | 657 | 26.3 | 2.3-5.1 | 0.1-0.4 | 14.3 | 1.9-3.3 | 6.6 |
| 2022-23 | 24 | 732 | 30.5 | 5.2-11.4 | 0.4-1.3 | 29.2 | 3.5-5.4 | 14.3 |
| 2023-24 | 28 | 843 | 30.1 | 6.1-13.7 | 0.5-1.3 | 37.0 | 4.5-6.6 | 17.2 |
| 2024-25 | 31 | 886 | 28.6 | 6.9-14.7 | 0.6-1.7 | 34.2 | 5.9-8.0 | 20.2 |
| Total | 108 | 3118 | 28.9 | 5.3-11.6 | 0.4-1.2 | 32.3 | 4.1-6.1 | 15.1 |
Career Stats: Shooting per 40 min
| gp | min/g | fg/g | 3pt/g | ft/g | ppg | |
|---|---|---|---|---|---|---|
| Event | ||||||
| Total | 24 | 30.5 | 4.0-8.7 | 0.3-1.0 | 2.7-4.1 | 10.9 |
| Conference | 18 | 30.8 | 4.1-8.7 | 0.3-0.8 | 2.7-4.1 | 11.3 |
| Exhibition | - | - | 0.0-0.0 | 0.0-0.0 | 0.0-0.0 | - |
| Location | ||||||
| Home | 10 | 30.8 | 4.1-8.8 | 0.4-1.3 | 2.7-4.3 | 11.3 |
| Away | 11 | 30.7 | 4.1-8.5 | 0.2-0.5 | 2.7-3.8 | 11.1 |
| Neutral | 3 | 28.7 | 3.0-8.7 | 0.3-2.0 | 2.3-4.7 | 8.7 |
| Result | ||||||
| Wins | 8 | 29.0 | 2.8-7.0 | 0.1-0.6 | 3.0-4.5 | 8.6 |
| Losses | 16 | 31.3 | 4.6-9.5 | 0.4-1.2 | 2.5-3.9 | 12.0 |
| Month | ||||||
| November | 6 | 26.5 | 2.0-6.0 | 0.2-1.3 | 1.5-3.0 | 5.7 |
| December | 4 | 32.3 | 3.2-9.2 | 0.2-1.2 | 3.0-4.0 | 9.8 |
| January | 8 | 31.6 | 4.6-8.9 | 0.2-0.8 | 3.4-5.4 | 12.9 |
| February | 6 | 31.8 | 5.5-10.7 | 0.5-0.8 | 2.7-3.7 | 14.2 |
Splits Stats: Shooting per game
| gp | gs | min | fg | pct | 3pt | pct | ft | pct | pts | |
|---|---|---|---|---|---|---|---|---|---|---|
| Event | ||||||||||
| Total | 24 | 24 | 732 | 95-208 | 45.7 | 7-24 | 29.2 | 64-99 | 64.6 | 261 |
| Conference | 18 | 18 | 554 | 74-157 | 47.1 | 6-15 | 40.0 | 49-73 | 67.1 | 203 |
| Exhibition | - | - | - | 0-0 | - | 0-0 | - | 0-0 | - | 0 |
| Location | ||||||||||
| Home | 10 | 10 | 308 | 41-88 | 46.6 | 4-13 | 30.8 | 27-43 | 62.8 | 113 |
| Away | 11 | 11 | 338 | 45-94 | 47.9 | 2-5 | 40.0 | 30-42 | 71.4 | 122 |
| Neutral | 3 | 3 | 86 | 9-26 | 34.6 | 1-6 | 16.7 | 7-14 | 50.0 | 26 |
| Result | ||||||||||
| Wins | 8 | 8 | 232 | 22-56 | 39.3 | 1-5 | 20.0 | 24-36 | 66.7 | 69 |
| Losses | 16 | 16 | 500 | 73-152 | 48.0 | 6-19 | 31.6 | 40-63 | 63.5 | 192 |
| Month | ||||||||||
| November | 6 | 6 | 159 | 12-36 | 33.3 | 1-8 | 12.5 | 9-18 | 50.0 | 34 |
| December | 4 | 4 | 129 | 13-37 | 35.1 | 1-5 | 20.0 | 12-16 | 75.0 | 39 |
| January | 8 | 8 | 253 | 37-71 | 52.1 | 2-6 | 33.3 | 27-43 | 62.8 | 103 |
| February | 6 | 6 | 191 | 33-64 | 51.6 | 3-5 | 60.0 | 16-22 | 72.7 | 85 |
Splits Stats: Shooting totals
| gp | min | min/g | fg/40 | 3pt/40 | pct | ft/40 | pts/40 | |
|---|---|---|---|---|---|---|---|---|
| Event | ||||||||
| Total | 24 | 732 | 30.5 | 5.2-11.4 | 0.4-1.3 | 29.2 | 3.5-5.4 | 14.3 |
| Conference | 18 | 554 | 30.8 | 5.3-11.3 | 0.4-1.1 | 40.0 | 3.5-5.3 | 14.7 |
| Exhibition | - | - | - | 0.0-0.0 | 0.0-0.0 | - | 0.0-0.0 | - |
| Location | ||||||||
| Home | 10 | 308 | 30.8 | 5.3-11.4 | 0.5-1.7 | 30.8 | 3.5-5.6 | 14.7 |
| Away | 11 | 338 | 30.7 | 5.3-11.1 | 0.2-0.6 | 40.0 | 3.6-5.0 | 14.4 |
| Neutral | 3 | 86 | 28.7 | 4.2-12.1 | 0.5-2.8 | 16.7 | 3.3-6.5 | 12.1 |
| Result | ||||||||
| Wins | 8 | 232 | 29.0 | 3.8-9.7 | 0.2-0.9 | 20.0 | 4.1-6.2 | 11.9 |
| Losses | 16 | 500 | 31.3 | 5.8-12.2 | 0.5-1.5 | 31.6 | 3.2-5.0 | 15.4 |
| Month | ||||||||
| November | 6 | 159 | 26.5 | 3.0-9.1 | 0.3-2.0 | 12.5 | 2.3-4.5 | 8.6 |
| December | 4 | 129 | 32.3 | 4.0-11.5 | 0.3-1.6 | 20.0 | 3.7-5.0 | 12.1 |
| January | 8 | 253 | 31.6 | 5.8-11.2 | 0.3-0.9 | 33.3 | 4.3-6.8 | 16.3 |
| February | 6 | 191 | 31.8 | 6.9-13.4 | 0.6-1.0 | 60.0 | 3.4-4.6 | 17.8 |
Splits Stats: Shooting per 40 min
| gp | off/g | def/g | reb/g | ast/g | to/g | stl/g | blk/g | |
|---|---|---|---|---|---|---|---|---|
| Event | ||||||||
| Total | 24 | 2.2 | 7.0 | 9.1 | 1.5 | 2.4 | 0.6 | 0.6 |
| Conference | 18 | 2.1 | 7.4 | 9.4 | 1.6 | 2.4 | 0.5 | 0.7 |
| Exhibition | - | - | - | - | - | - | - | - |
| Location | ||||||||
| Home | 10 | 1.9 | 6.3 | 8.2 | 1.5 | 2.6 | 0.4 | 0.6 |
| Away | 11 | 2.5 | 7.7 | 10.2 | 1.7 | 2.4 | 0.7 | 0.7 |
| Neutral | 3 | 2.0 | 6.3 | 8.3 | 1.0 | 1.7 | 0.7 | 0.3 |
| Result | ||||||||
| Wins | 8 | 2.1 | 6.4 | 8.5 | 1.4 | 2.5 | 0.5 | 0.4 |
| Losses | 16 | 2.2 | 7.3 | 9.4 | 1.6 | 2.3 | 0.6 | 0.8 |
| Month | ||||||||
| November | 6 | 2.2 | 5.8 | 8.0 | 1.3 | 1.5 | 0.5 | 0.3 |
| December | 4 | 2.8 | 5.5 | 8.3 | 1.0 | 2.3 | 0.8 | 0.3 |
| January | 8 | 2.3 | 7.3 | 9.5 | 1.9 | 2.0 | 0.6 | 0.9 |
| February | 6 | 1.7 | 8.7 | 10.3 | 1.7 | 3.8 | 0.5 | 0.8 |
Splits Stats: Ball control per game
| gp | gs | pf | dq | a/to | |
|---|---|---|---|---|---|
| Event | |||||
| Total | 24 | 24 | 63 | - | 0.6 |
| Conference | 18 | 18 | 49 | - | 0.6 |
| Exhibition | - | - | - | - | - |
| Location | |||||
| Home | 10 | 10 | 25 | - | 0.6 |
| Away | 11 | 11 | 30 | - | 0.7 |
| Neutral | 3 | 3 | 8 | - | 0.6 |
| Result | |||||
| Wins | 8 | 8 | 22 | - | 0.6 |
| Losses | 16 | 16 | 41 | - | 0.7 |
| Month | |||||
| November | 6 | 6 | 16 | - | 0.9 |
| December | 4 | 4 | 8 | - | 0.4 |
| January | 8 | 8 | 23 | - | 0.9 |
| February | 6 | 6 | 16 | - | 0.4 |
Splits Stats: Ball control totals
| gp | off/40 | def/40 | reb/40 | ast/40 | to/40 | stl/40 | blk/40 | |
|---|---|---|---|---|---|---|---|---|
| Event | ||||||||
| Total | 24 | 2.8 | 9.1 | 12.0 | 2.0 | 3.1 | 0.8 | 0.8 |
| Conference | 18 | 2.7 | 9.6 | 12.3 | 2.0 | 3.2 | 0.6 | 0.9 |
| Exhibition | - | - | - | - | - | - | - | - |
| Location | ||||||||
| Home | 10 | 2.5 | 8.2 | 10.6 | 1.9 | 3.4 | 0.5 | 0.8 |
| Away | 11 | 3.2 | 10.1 | 13.3 | 2.2 | 3.1 | 0.9 | 0.9 |
| Neutral | 3 | 2.8 | 8.8 | 11.6 | 1.4 | 2.3 | 0.9 | 0.5 |
| Result | ||||||||
| Wins | 8 | 2.9 | 8.8 | 11.7 | 1.9 | 3.4 | 0.7 | 0.5 |
| Losses | 16 | 2.8 | 9.3 | 12.1 | 2.1 | 3.0 | 0.8 | 1.0 |
| Month | ||||||||
| November | 6 | 3.3 | 8.8 | 12.1 | 2.0 | 2.3 | 0.8 | 0.5 |
| December | 4 | 3.4 | 6.8 | 10.2 | 1.2 | 2.8 | 0.9 | 0.3 |
| January | 8 | 2.8 | 9.2 | 12.0 | 2.4 | 2.5 | 0.8 | 1.1 |
| February | 6 | 2.1 | 10.9 | 13.0 | 2.1 | 4.8 | 0.6 | 1.0 |
Splits Stats: Ball control per 40 min


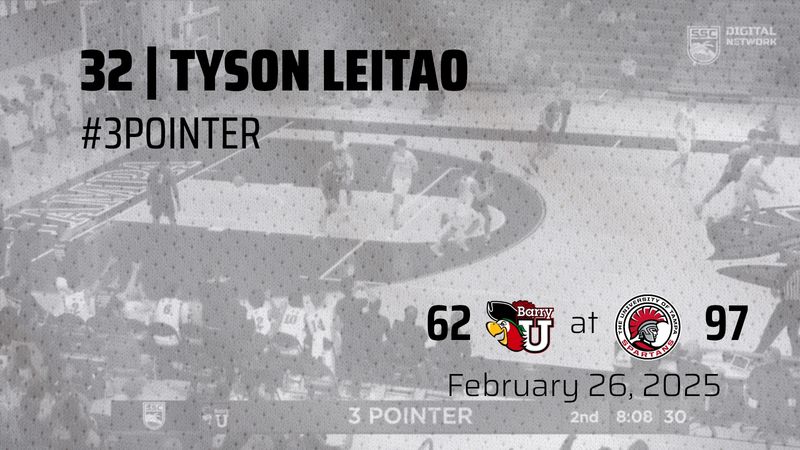
 Feb 26 '25: W, 97-62
  Feb 19 '25: W, 95-83
  Feb 15 '25: W, 73-70
  Feb 12 '25: W, 85-69
  Feb 5 '25: L, 66-100
  Jan 25 '25: W, 95-86
  Jan 18 '25: T, 0-0
  Jan 4 '25: W, 99-92
  Dec 21 '24: T, 0-0
  Dec 20 '24: T, 0-0
  Nov 30 '24: W, 103-96
  Nov 29 '24: T, 0-0
  Nov 16 '24: T, 0-0
  Dec 16 '23: W, 76-72
  Nov 18 '23: L, 80-86
  Nov 12 '23: L, 78-100
  Nov 11 '23: W, 82-68
  Dec 17 '22: L, 53-69
  Dec 18 '21: W, 76-48